

This week the SNKRS calendar ran live drops from July 6 through July 10, featuring Jordan releases and coordinated drops across Nike, Adidas, and competing brands. Sneaker trackers lit up like departure boards. Limited Jordan drops routinely sell out in minutes on SNKRS, generating millions in secondary volume within the first 24 hours. Nike drives its own demand engine while simultaneously raising the temperature for the entire sneaker category.
The calendar is the machine now. A drop isn’t just a release; it’s appointment media. The platform sets the time, the temperature, and the stakes for consumers, resellers, and smaller retailers alike. It tells everyone when to show up, how limited the object is, and how fast it’ll vanish. On high-heat Nike releases, average resale premiums hit 30-60% above retail in the opening window, turning a $200 pair into $260–$320+ almost instantly. This creates outsized returns for Nike’s own ecosystem while training the broader market to treat all limited sneakers as timed events.
Commerce learned the rhythms of media and made them transactional at scale.
The global sneaker resale market exceeded $10 billion in gross merchandise value in 2025 and is projected to surpass $30 billion, growing at 20-28% CAGR. For consumers and retailers, the individual shoe still matters, but the ritual around Nike-led drops namely timing, tension, and social proof all drive disproportionate economics across the industry. StockX saw nearly 200 brands set records in 2025, many riding the wave of heightened attention Nike programs for the whole category. That’s where Nike’s real power sits.
They own the surface where demand gathers for their own products and, by extension, for the wider sneaker culture. They control the clock, the queue, the rules, and the demand signal. Everyone else such as everyday consumers, competing brands, boutique retailers, and secondary traders all operate inside a system they didn’t design: artificial limits set by Nike’s cadence, platform gates, and a resale market that rewards participation in the ecosystem Nike shapes.
The larger point is structural. The drop calendar has become infrastructure for repeat attention. It trains millions of consumers and resellers to show up on command and turns shopping into a timed event with predictable outcomes. Nike’s SNKRS releases generate millions in first-day secondary volume while reinforcing heat across the $110+ billion global sneaker market, lifting its own sales and elevating category-wide behavior and expectations.



Topps is changing the packaging because the secondary market started rewriting the rules. For the 2025-26 Chrome Updates Basketball Mega Box launching today at $69.99, every unit ships with the factory seal removed. The goal is simple: slow instant flips and give collectors a better shot at retail after $529.99 hobby boxes reached $975, a $445 gap that made the sealed box the real product. This is a market redesign.
Scarcity drops have long relied on limited supply, compressed windows, and resale validation. The model works until the flip captures too much margin. An 85 percent plus premium on sealed inventory before anyone opens a pack distorts supply and demand. Collectors get priced out. Perceived value detaches from the experience. The brand’s core audience feels like supporting cast in someone else’s arbitrage.
The broader numbers reveal the pressure. The global trading cards market stands at roughly $2 billion in 2026 and is projected to reach $13.4 billion by 2035 at a 23 percent CAGR. When resale premiums on hot releases routinely hit 50 to 100 percent, retail boxes get hoarded, street supply shrinks, and the aftermarket becomes the main liquidity event. Topps’ unsealed approach directly reduces one form of clean arbitrage.
Nike also shows the pattern at scale. The sneaker resale market exceeded $10 billion GMV in 2025 and heads toward $30 billion with 20 to 28 percent annual growth. Limited supply creates heat. Resale amplifies it but also introduces volatility. Oversupply in a single quarter can crash secondary values 30 to 50 percent. Unchecked, it destabilizes the primary market and trains buyers to wait for flips instead of buying at retail.
Topps is intervening early. Weakening the sealed premium pushes the product back toward opening and collecting. It may frustrate speculators, but it supports long term collector trust and steadier demand. Mature platforms eventually govern the scarcity they create. Access rules, distribution, and even packaging become strategic tools.
If Topps succeeds, collectors could see 30 to 50 percent higher open pack rates on these products, expanding the active user base and driving more consistent primary sales in a $2 billion trading card market. This approach mirrors successful platform interventions that stabilized demand and supported long term category growth at 23 percent CAGR. Rebuilding trust looks like more fans actually opening products at retail, higher repeat purchase rates, and stronger community engagement instead of resentment toward flippers. It is destined to work if it shifts value perception back to the collecting experience. If it fails, sealed premiums may migrate to other lines or products. Past attempts, such as Panini’s product allocation limits and increased print runs in 2022-2023, often only increased grey market sophistication and failed to reduce premiums meaningfully, potentially capping the market well below the $13.4 billion 2035 projection and slowing industry expansion by limiting broad participation.

The next $100 billion opportunity sits in controlled attention surfaces across emerging markets. These interfaces allow companies to capture, structure, and monetize attention before competitors in economies such as India, China, Brazil, and Indonesia where digital adoption is accelerating at 15 to 25 percent annually and consumer spending is forecast to add trillions to global GDP by 2035.
Global car infotainment systems are projected to exceed $50 billion by 2030 with India and China driving over 40 percent of new growth through rising vehicle sales exceeding 30 million units annually and connectivity mandates. Smart home displays and voice commerce are expanding toward a $30 billion global market with Brazil and Indonesia posting 20 percent plus yearly increases from expanding urban middle classes of over 100 million people. Digital out of home advertising, a $40 billion category worldwide, is growing at 10 to 18 percent CAGR in emerging markets where India alone is adding thousands of digital screens each year and China leads with over 20 percent market share growth. Retail media networks surpassed $100 billion globally in 2025 with Southeast Asia and Latin America contributing some of the highest regional growth rates above 25 percent. Drop commerce platforms and embedded AI assistants add tens of billions more in high margin revenue from these populations exceeding one billion in India and China.
Nike uses SNKRS to dictate when millions gather in China and India where select drops generate millions in first day volume and drive over 30 percent of regional hype cycles.
Topps now shapes collector behavior in growing trading card markets across Southeast Asia where the category is expanding at over 20 percent annually with millions of new participants. GM and local partners fight for the dashboard in Brazil and Indonesia where connected vehicle penetration is rising 15 to 30 percent per year amid vehicle sales growth of 5 to 8 percent. Amazon and regional players own the kitchen counter and living room in India with smart display adoption growing over 25 percent yearly across 300 million plus urban consumers. Google targets parked cars across China. Digital out of home turns streets, malls, airports, and transit corridors into programmable inventory in markets projected to add over $15 billion in annual ad spend by 2030.
Owned interfaces decide what users see first in India and Brazil where consumer screens are multiplying at double digit rates with smartphone penetration above 70 percent. Screen operating systems structure behavior across China and Indonesia with operating system tied devices growing 18 to 25 percent yearly. AI assistants guide choice and capture data in populations where voice commerce is expanding over 30 percent annually and generating billions in transactions. Commerce layers convert faster with 40 percent higher conversion rates on controlled surfaces. Identity and login systems strengthen measurement. Programmatic inventory and access controls become premium in high demand urban centers where scarcity rules command 20 to 40 percent pricing power.
Dumb screens commoditize with margins dropping 15 to 25 percent yearly as competition intensifies. Generic display inventory erodes as programmatic alternatives capture 30 percent more efficiency and shift billions in spend. Product drops without strategy underperform by 40 to 60 percent against well orchestrated local competitors in markets with over one billion digital users. Hardware without software ownership becomes marginal with attached services driving 50 percent plus of profits in connected ecosystems. Commerce without data capture leaves tens of billions in potential revenue untapped in populations exceeding one billion in India and China alone.
Content remains important, but without controlled access it is easily underpriced with margins compressing 20 to 35 percent in open emerging markets. The owning surface determines how desire is organized, how behavior is measured, how commerce is delivered, and who keeps the margin across India, China, Brazil, and Indonesia where consumer spending is forecast to add trillions to the global economy by 2035 and digital ad investment grows 15 to 25 percent annually.
The background stories from Google, GM, Amazon, and OAAA show the infrastructure direction playing out strongly in emerging markets. Google is deepening Android Auto and Gemini integration in vehicles across India and China where connected car sales are growing over 25 percent yearly. GM is phasing out third party systems in favor of its own platform in Brazil and other Latin American markets where in car commerce could add $5 billion plus in regional value. Amazon is expanding Alexa visual shopping on Echo devices in India with smart home penetration rising 20 to 30 percent. OAAA standardization efforts support digital out of home growth in Indonesia and Brazil where the sector is expanding at 15 to 20 percent CAGR and turning public spaces into measurable inventory worth billions annually. The market is building surfaces that do more than display in these regions with digital infrastructure investment growing 15 to 25 percent annually. They schedule demand. They measure outcomes. They execute sales. They govern access. The prize is no longer attention alone. The prize is control of the moment when attention becomes action in the world’s fastest growing consumer economies projected to deliver over 60 percent of global growth through 2035.
US equities rebounded on 9 July. The S&P 500 rose 0.81%, the Nasdaq gained 1.30%, the Dow added 0.27%, and the Russell 2000 climbed 1.2%. The session was growth-friendly and tech-led, helped by easing oil pressure and a revived AI/chip trade, but the attention-economy read was narrower: capital moved toward software interfaces, spatial tools, productivity systems, and screen-based distribution, while more capital-heavy captive-audience infrastructure lagged.
Inside the specified industries, the market rewarded interfaces that organize behavior: task systems, 3D creation environments, synchronous voice/video infrastructure, connected productivity platforms, and in-car voice layers. It did not simply buy “media.” It bought the places where users work, speak, build, navigate, watch, and transact.
The weaker side was more revealing. In-flight/captive connectivity sold off sharply. Collectible and resale names were mixed. DOOH and transit attention remained stable but unexciting. The tape favored software that structures daily behavior over hardware that simply hosts it.
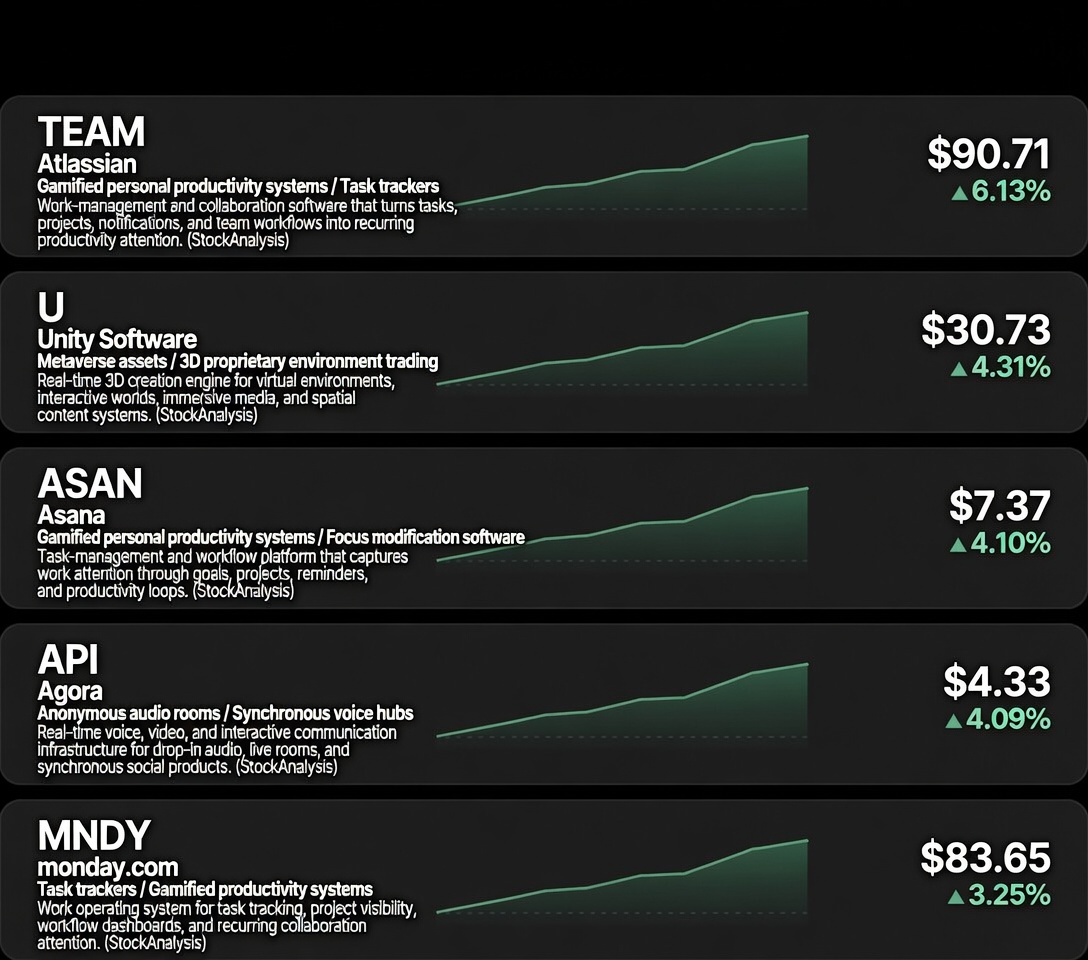
The market rewarded productivity as an attention system. Atlassian, Asana, and monday.com were the cleanest winners in the corrected universe. These are not “enterprise software” names in this frame. They are work-attention operating systems. They convert tasks, deadlines, reminders, tickets, comments, and dashboards into daily behavioral loops. Capital rewarded the software layer that keeps professional attention structured.
Spatial creation got paid (Unity): Unity’s move mattered because it is one of the few public-market proxies for real-time 3D environments, metaverse assets, and proprietary virtual-world tooling. The market was not buying metaverse hype. It was buying the infrastructure that lets developers build persistent interactive environments.
Voice infrastructure participated (Agora): Agora gave the session a direct link to anonymous audio rooms, drop-in audio social networks, and synchronous voice hubs. Clubhouse-style consumer audio may not have clean public proxies, but Agora sits underneath the real-time communication layer. Capital rewarded the infrastructure, not necessarily the consumer app format.
In-car interface exposure also worked (Cerence, Visteon): Cerence closed at $10.46, up 2.85%, and Visteon closed at $106.84, up 2.45%. That matters for smart vehicle infotainment systems, voice-UI portals, and in-car content ecosystems. The car is becoming a captive screen-and-voice environment. The market priced some of that interface value.
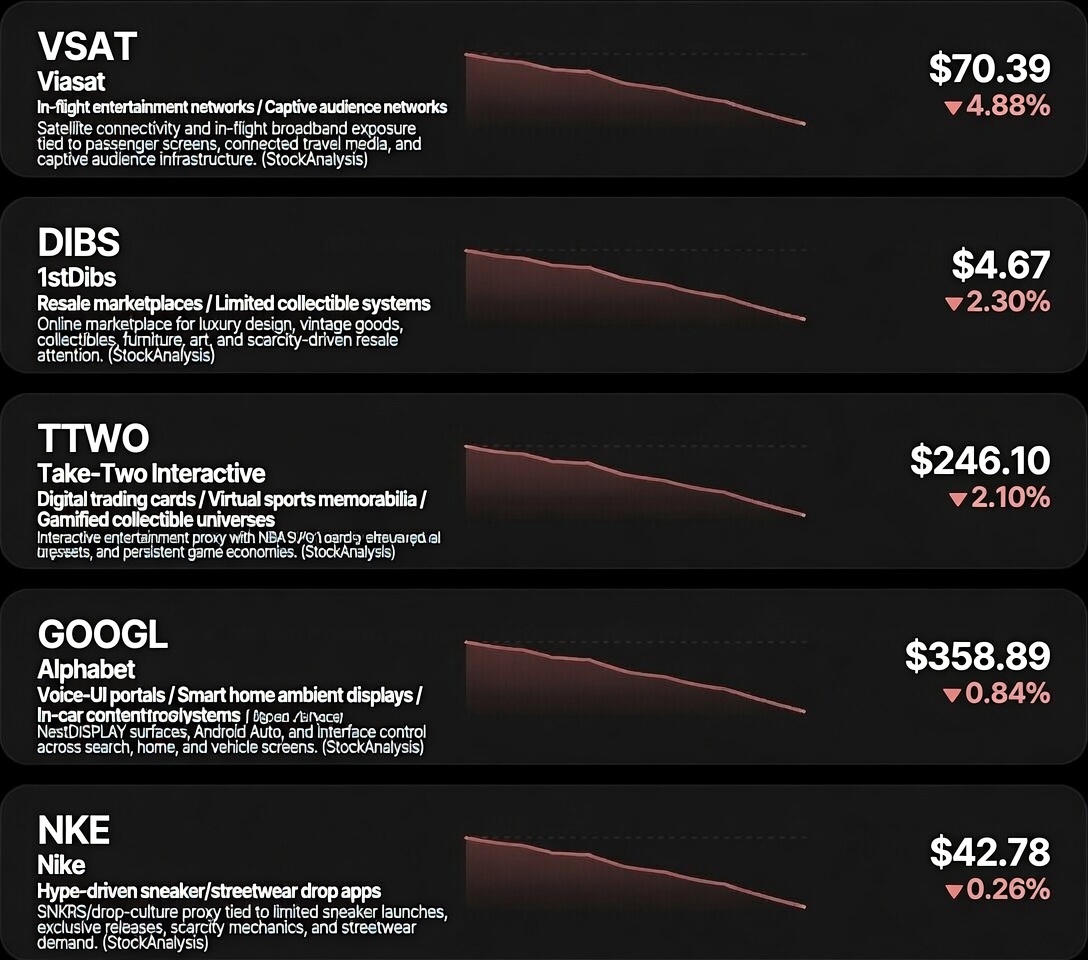
Captive travel attention was punished. Viasat was the clear negative. It is not a pure media company, but it is a direct proxy for connected passenger attention: aircraft connectivity, in-flight screens, streaming access, and travel-time media consumption. The market marked that exposure down sharply.
Collectible commerce did not get a strong bid: GameStop slipped and Etsy only rose 0.67%. eBay performed better, closing at $117.33, up 1.80%, but the broader collectible/resale cluster was not the center of the tape. Capital rewarded liquidity where the marketplace is broad and scaled; it was less enthusiastic about narrower fandom-commerce or niche marketplace exposure.
DOOH was inert: Clear Channel Outdoor closed flat. Lamar and National CineMedia rose, but modestly: Lamar gained 1.35%, and National CineMedia gained 1.31%. That tells us the market did not reject public-screen advertising, but it also did not aggressively reprice it. DOOH attention remained stable, not exciting.
Navigation and ambient-device interfaces lagged the software names: Garmin gained only 0.40%, while Roku gained 0.73% and Sonos rose 1.88%. These are relevant to screen-based IoT media, smart home ambient displays, and voice/audio portals, but the market preferred enterprise productivity and real-time 3D software over consumer hardware-adjacent attention surfaces.
